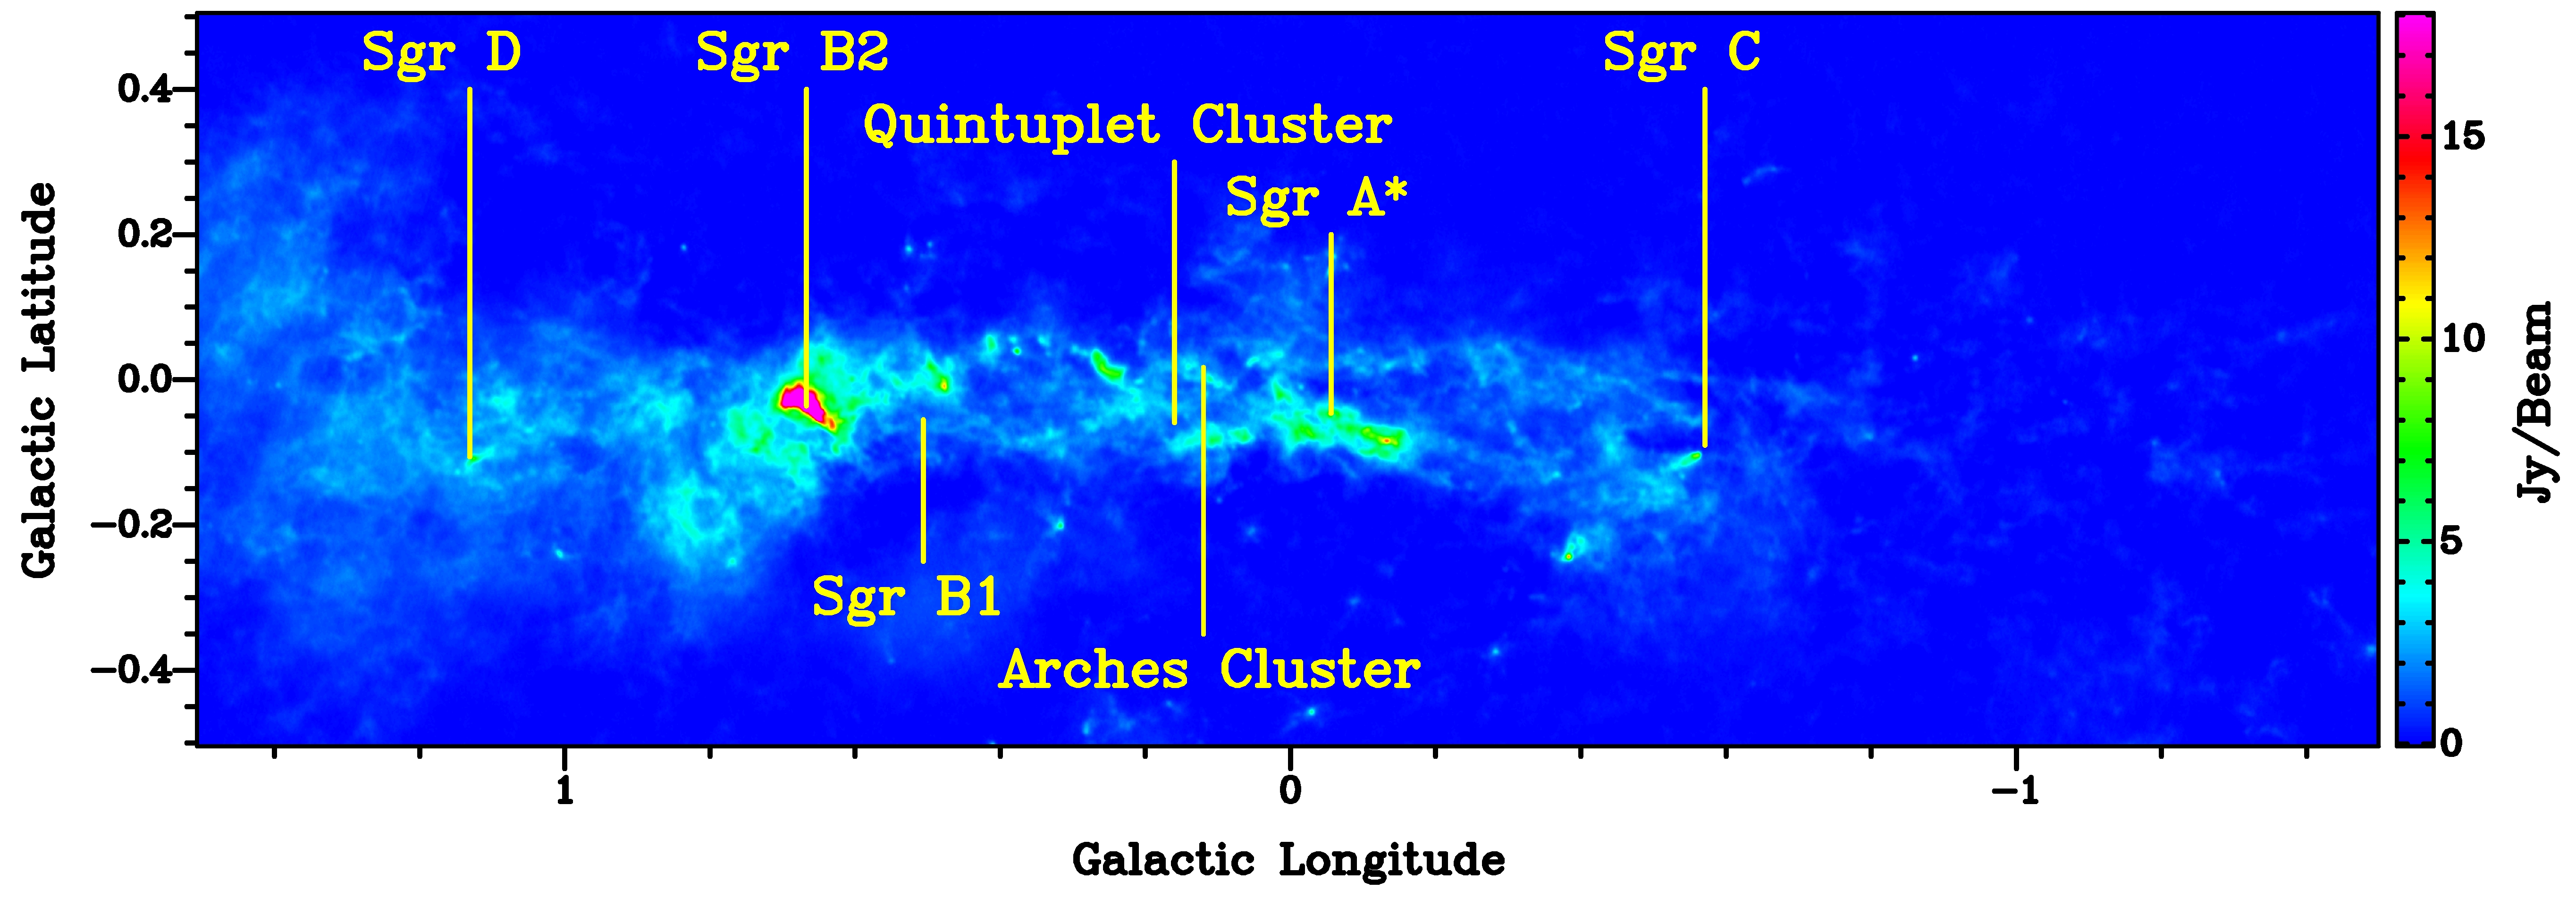
The central few hundred parsec of our Galaxy (|l|<1.5°, |b|<0.5°), the so-called Central Molecular Zone (CMZ), present an exceptional environment with extreme conditions in the Milky Way. Here, the gas temperatures, velocity dispersions, magnetic field strengths, pressure, etc. are much higher than in the Galactic disk (Morris & Serabyn 1996).
![Spatial extent parameter vs the [7]-[15] color](images/sigma15vs7-15_2.png)
Star formation rate
Infrared observations of the Central Molecular Zone
We analyzed Spitzer Infrared Spectrograph observations of a sample of 68 ISOGAL sources with unknown natures which are located in the CMZ. Based on the slope of the spectra and different emission and absorption features, we classified these sources as star-forming or evolved objects. This sample was chosen to test selection criteria which were based on the ISOGAL [7]-[15] color and the spatial extent parameter. We revised these criteria until they reliably distinguished between young and evolved objects. Based on these ISOGAL as well as additional MSX selection criteria, we constructed a sample of 1141 young object candidates, which are all located in the CMZ. Via bolometric luminosity conversion factors, we obtained the luminosity and subsequently the masses of these objects. Applying a Kroupa initial mass function, the total mass of young objects, formed over the past 1 Myr, was derived and an average star formation rate of 0.08 solar masses per year was estimated for the CMZ (Immer et al. 2012).
Gas temperatures
Submillimeter observations of six CMZ clouds
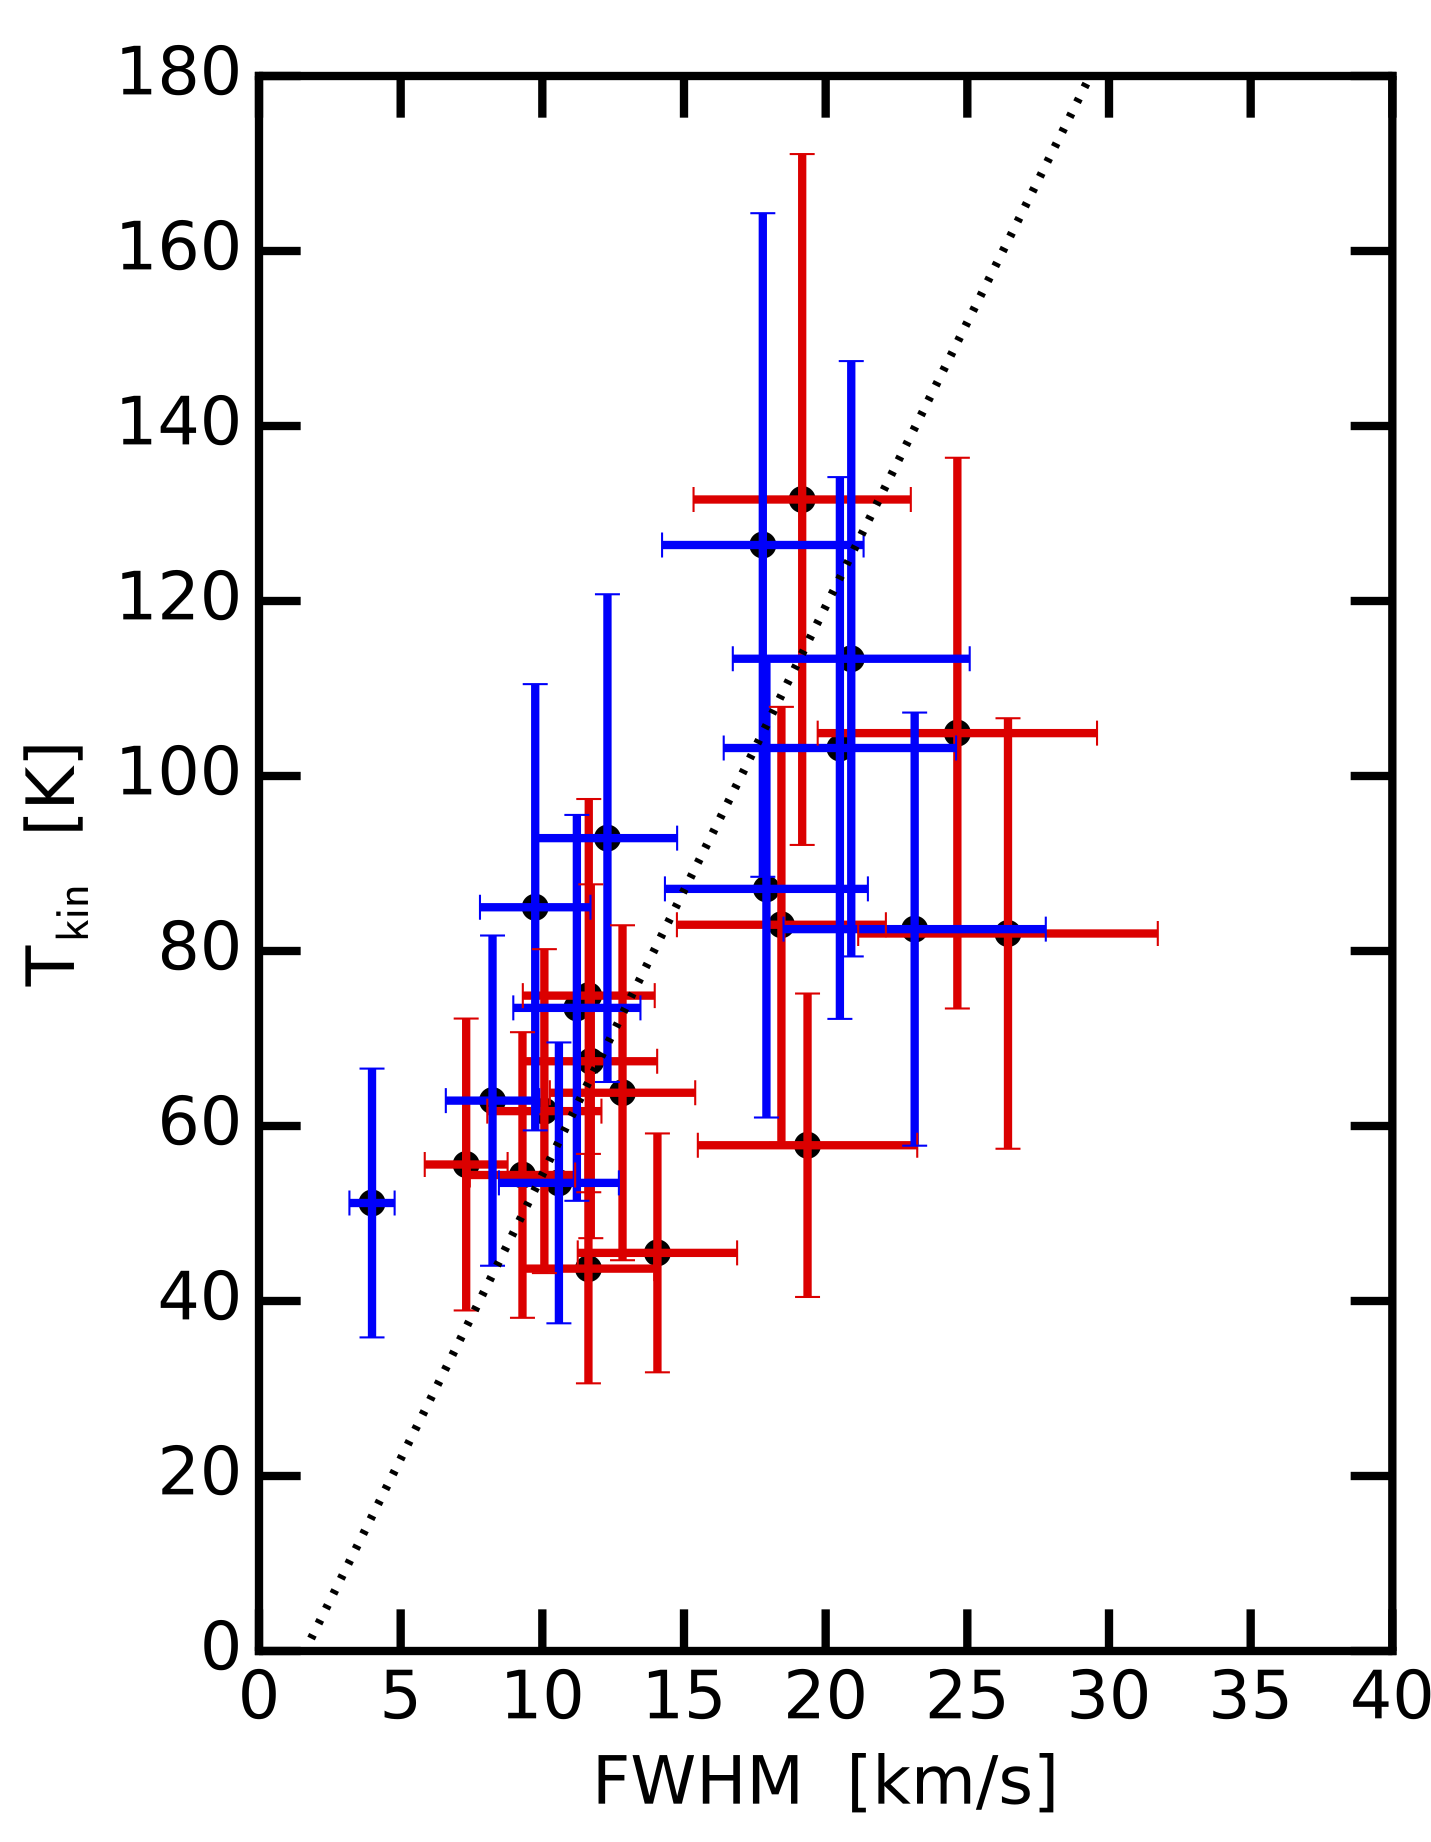
The high gas temperatures of the CMZ clouds are one of their key properties, influencing the star formation efficiency of the clouds as well as their chemistry (Ao et al. 2013, Ginsburg et al. 2016). Based on APEX observations of the H2CO molecule at 218 and 291 GHz of seven Galactic Center clouds in combination with radiative transfer models, we showed that there are temperature gradients across the clouds. Determining the average temperature and the width of the H2CO lines at selected positions in the clouds, we revealed a positive correlation between the line width and the temperature, which is direct evidence for gas heating via turbulence (Immer et al. 2016).
To test the accuracy of the high gas temperatures, I observed multiple other temperature tracers in these clouds (CH3OH, CH3CCH, CH3CN). Combining APEX SiO observations with archival observations of other SiO transitions, we will perform an excitation analysis of this molecule and evaluate if the high gas temperatures are caused by shocks in the clouds (Immer et al., in prep.)


Searching for signs of star formation
Radio observations of the dust ridge clouds
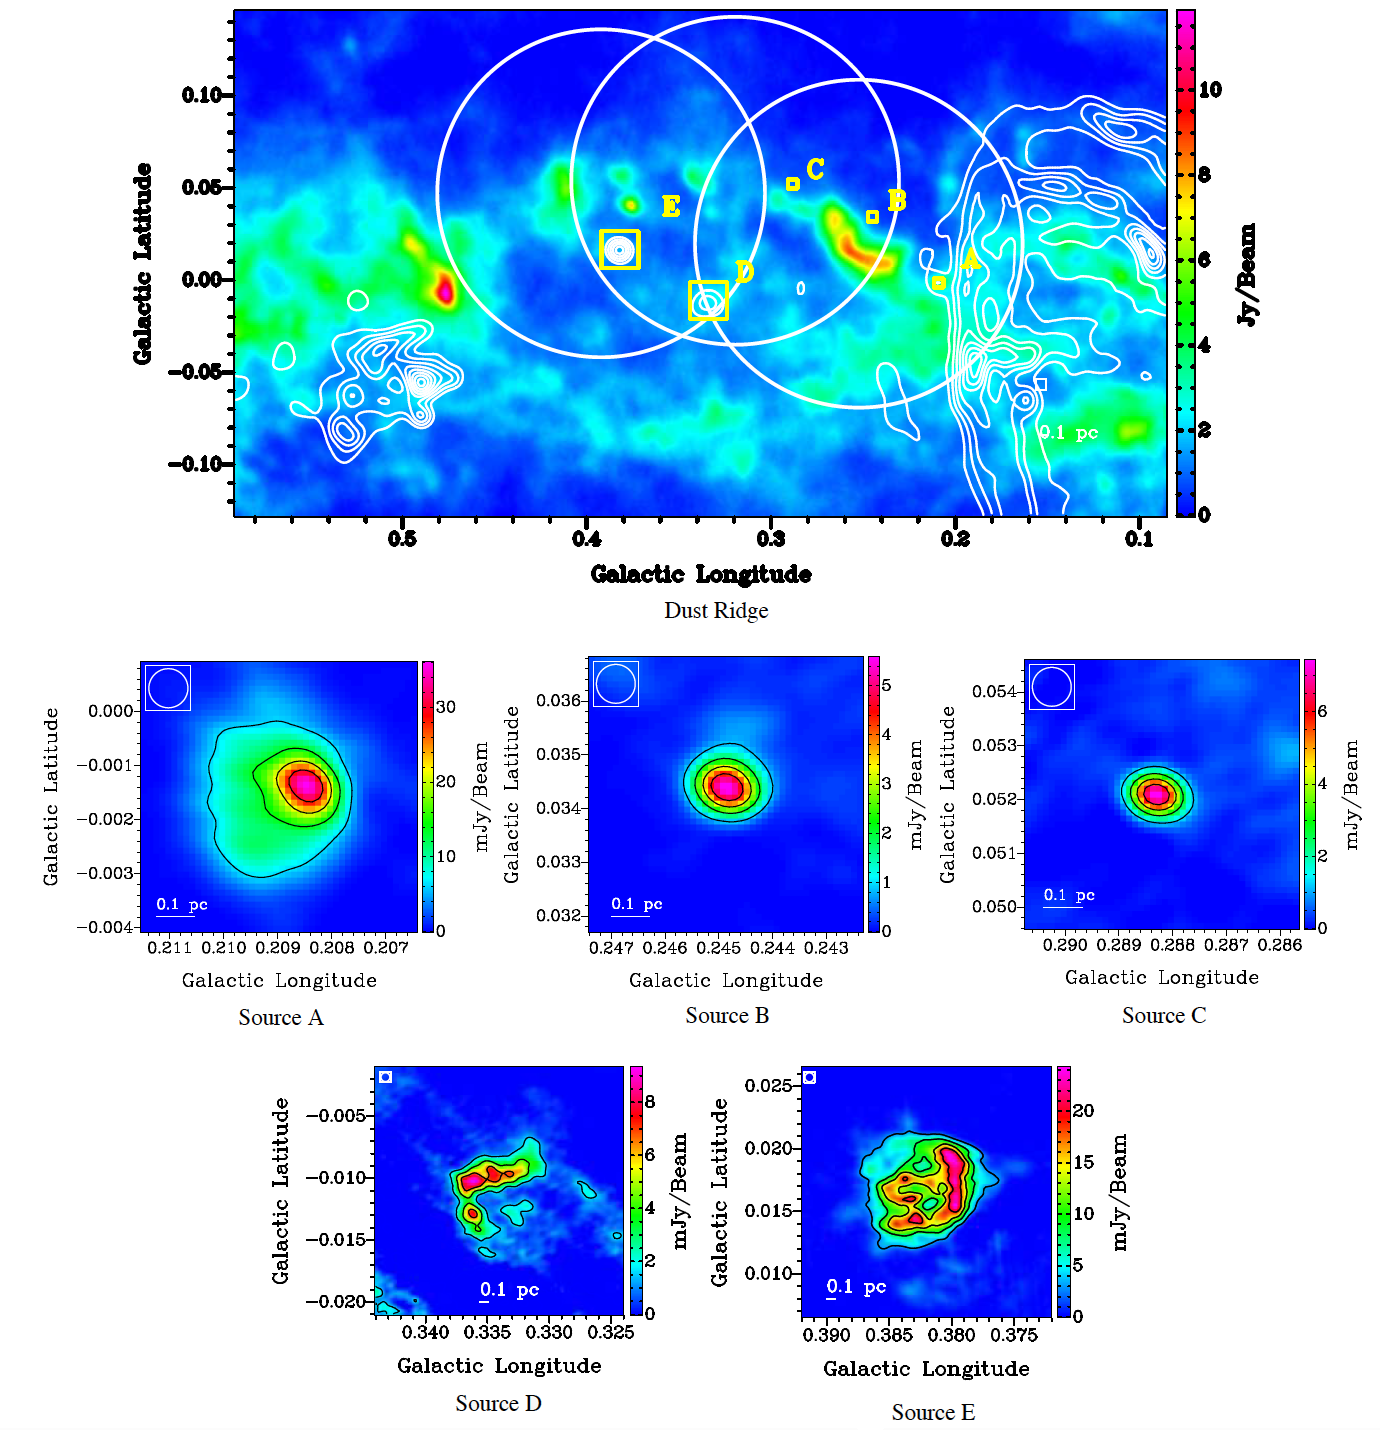
The CMZ contains the so called dust ridge (Lis & Carlstrom 1994), a narrow ridge of dust clouds, which is located between the radio continuum sources G0.18-0.04 and Sgr B2. Due to the high masses (13000-150000 M⊙) and the low dust temperatures (15-22 K) of the clouds, it is possible that an active site of future star formation will develop in this region. The detection of Class II methanol masers indicates the formation of high-mass stars in two of the clouds. To look for advanced star formation in the clouds, we observed the dust ridge region at 8.4 GHz with the Very Large Array (VLA). Analyzing the data, we detected five radio sources outside of the dust ridge clouds, in low column density regions. These sources are probably all excited by young high-mass stars. However, the existence of ionizing stars with spectral types earlier than B0.5 within the dust ridge clouds is excluded by these observations. The dust ridge contains the famous source M0.25+0.012 (e.g. Longmore et al. 2012) which is, together with cloud e, the most massive cloud in the dust ridge. Although the clouds are very similar in mass and size, G0.253+0.016 does not contain any clear signs of high-mass star formation while cloud e contains methanol masers, indicating ongoing star formation (Immer et al. 2012).
Copyright © 2020 · All Rights Reserved · Home